What is a Yamazumi chart?
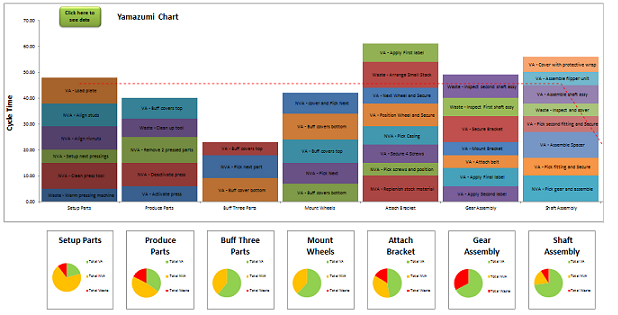
A Yamazumi chart (or Yamazumi board) is a stacked bar chart that shows the work content and cycle time within a process. It is used in Lean improvement to visualize workload, identify imbalance, expose waste and support standard work decisions.
The Yamazumi chart makes process balancing easier
The Yamazumi chart provides a mechanism to visualize how much effort is used in each stage of a process. It indicates which operations are overloaded, which are underutilized, and where work could be moved, simplified or removed.
Process tasks are individually represented in a stacked bar chart, these can be categorized as either Value Added, Non-Value Added or Waste. The mean duration time of each task is recorded and displayed within the bar chart. Each process task is stacked to represent the entire process step.
Yamazumi is a Japanese word that literally means to stack up
The Yamazumi chart y (vertical) axis represents cycle time. The x-axis represents each process step. A target cycle time (the mean cycle time) will be plotted to aid line balancing activities. The Yamazumi chart can be used for both process Waste Elimination or Line Balancing activity. Process steps can be rearranged or deleted to optimize and balance the target process.
The tool is intended to support Business Process Improvement teams. It is also a useful Lean training aid. Yamazumi charts are used by Lean improvement teams throughout many process-driven organizations. Toyota is noted to be a user of this tool.
Free templates
Download a free Yamazumi Process Modeling Tool template for Microsoft® Excel®
More Free Quality Tool downloads
Related improvement resources
DMAIC improvement process Lean A3 ThinkingHow to build a useful Yamazumi chart
Begin by observing the process and listing the work elements in the order they happen. Measure the time for each task using a consistent method, then group each element as value-added, necessary non-value-added, or waste. The chart becomes more useful when the team agrees the categories and understands the target cycle time.
Once the current state is visible, look for overloaded steps, waiting time, repeated handling, unnecessary movement, and work that could be moved or simplified. A Yamazumi chart should lead to a practical discussion about line balance, standard work, training needs, and improvement priorities.