Free quality tools and templates
Download practical free quality tools and Lean templates from Adaptive Business Management Systems for your continuous and sustainable improvement programs (CSIP) and Lean Six Sigma projects.
Please follow us on social media for updates and information about new free quality tools.
Improvement tools and lean templates for instant download
We currently offer the following free quality tools for download. They are available as easy-to-use and flexible spreadsheets for Microsoft® Excel® and documents for Microsoft® Word®. Simply click to download:
SPC run charts and KPI templates
- Individual/Moving-Range (IMR) Run Chart
- Proportions Run Chart (P Chart)
- X-bar and R Run Chart
- X-bar and S Run Chart
Statistical and analysis tool templates

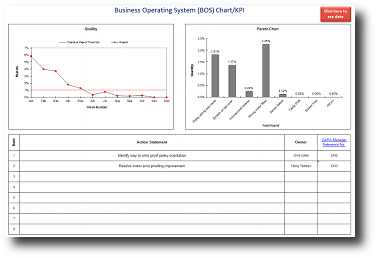
- BOS QOS Chart
- Descriptive Statistics Including Normality Test
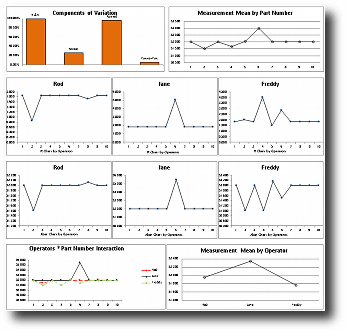
- Gauge R&R (MSA) (Crossed) Tool
- Histogram and Box Plot
- Individual values plot
- Pareto Tool
- Scatter Plot
- Tally Count (Microsoft Excel 2007+ only)
Lean and cost reduction tool templates
- Improvement request form
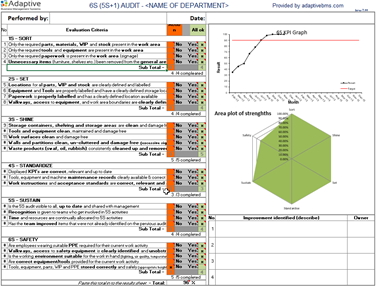
- 6S (5S+1) Audit Check Sheet
- 7 Measures of Performance in Lean KPI Tool
- How to 5S a Computer Workstation (Windows 7 Edition, Microsoft® Word® document)
- Lean and Value Process Modeling Tool
- 5S Red Tag Area Sign Template
- 5S Red Tag Template
- Stock and Run Rate Optimizer
- Yamazumi Process Modeling Tool
Non-statistical and project tool templates
- H&S Risk Assessment Template
- 360 Degree Feedback Form
- Balanced Scorecard (Jam on Toast)
- Control Plan Tool
- FMEA Tool
- House Of Quality (QFD) (2007+ only)
- Ishikawa Fish Bone Tool
- Project Charter Template
- Project Closure Template
- Project Prioritization Matrix
- SIPOC (Suppliers, Inputs, Process, Outputs, Customers) Tool
- Six Sigma Project Tracking Dashboard
- Stakeholder Analysis (Power and Influence)
Process and reference articles
QMS-related standards
Process improvement solutions
Choosing the right quality tool
Start with the problem you are trying to understand. Use run charts and control charts when you need to see performance over time, Pareto charts when you need to prioritize causes, and Gauge R&R when you need to understand measurement variation before making decisions from data.
For team projects, combine these templates with a clear problem statement, action owner, review date, and evidence trail. That makes the output easier to connect with CAPA, 8D, DMAIC, or other continuous improvement activity.